
Standard Deviation Calculator
Calculate population or sample standard deviation with our precise equation-based tool
Introduction & Importance of Standard Deviation
Understanding variability in data through standard deviation
Standard deviation is a fundamental statistical measure that quantifies the amount of variation or dispersion in a set of values. Unlike simpler measures like range, standard deviation provides a more comprehensive understanding of how data points deviate from the mean (average) value of the dataset.
The equation to calculate standard deviation involves several mathematical operations that transform raw data into a meaningful metric of variability. For population standard deviation (σ), the formula is:
σ = √[Σ(xi – μ)² / N]
Where:
- σ (sigma) represents the population standard deviation
- Σ is the summation symbol
- xi represents each individual data point
- μ is the population mean
- N is the total number of data points
Standard deviation matters because:
- Risk Assessment: In finance, standard deviation helps measure investment volatility and risk
- Quality Control: Manufacturers use it to ensure product consistency
- Research Validity: Scientists rely on it to determine the reliability of experimental results
- Performance Evaluation: Educators use it to understand student performance distribution
Our calculator implements this exact equation to provide you with accurate standard deviation calculations for both population and sample datasets. The sample standard deviation formula differs slightly by using n-1 in the denominator instead of N, which corrects for bias in smaller samples.
How to Use This Standard Deviation Calculator
Step-by-step guide to accurate calculations
Follow these detailed instructions to calculate standard deviation using our equation-based tool:
-
Data Input:
- Enter your data points in the input field, separated by commas
- Example formats:
- Simple numbers: 5,7,8,12,15
- Decimal values: 3.2,4.5,6.7,8.1
- Negative numbers: -2,-1,0,1,2
- Maximum 100 data points allowed
-
Calculation Type Selection:
- Choose “Population Standard Deviation” if your data represents the entire population
- Select “Sample Standard Deviation” if your data is a subset of a larger population
- The calculator automatically adjusts the equation based on your selection
-
Calculation:
- Click the “Calculate Standard Deviation” button
- The tool processes your data through the standard deviation equation
- Results appear instantly with visual representation
-
Interpreting Results:
- The numerical result shows your standard deviation value
- The chart visualizes your data distribution
- Lower values indicate data points are closer to the mean
- Higher values suggest greater variability in your dataset
Standard Deviation Formula & Methodology
The mathematical foundation behind our calculator
Our calculator implements two variations of the standard deviation equation, depending on whether you’re analyzing a complete population or a sample:
1. Population Standard Deviation (σ)
The population standard deviation equation calculates the square root of the average squared deviations from the mean:
σ = √[Σ(xi – μ)² / N]
Calculation Steps:
- Calculate the mean (μ) of all data points
- For each data point, subtract the mean and square the result
- Sum all squared differences
- Divide by the number of data points (N)
- Take the square root of the result
2. Sample Standard Deviation (s)
The sample standard deviation uses a slightly modified equation to correct for bias in small samples:
s = √[Σ(xi – x̄)² / (n – 1)]
Key Differences:
- Uses sample mean (x̄) instead of population mean (μ)
- Divides by n-1 instead of N (Bessel’s correction)
- Provides an unbiased estimate of the population variance
Mathematical Properties:
- Standard deviation is always non-negative
- It has the same units as the original data
- Adding a constant to all data points doesn’t change the standard deviation
- Multiplying all data points by a constant multiplies the standard deviation by the absolute value of that constant
Our calculator handles all these mathematical operations automatically while maintaining precision through:
- Floating-point arithmetic with 15 decimal places
- Automatic detection of data format
- Real-time validation of input values
- Visual representation of data distribution
Real-World Examples of Standard Deviation
Practical applications across industries
Example 1: Investment Portfolio Analysis
Scenario: An investor compares two stocks over 12 months:
| Month | Stock A Return (%) | Stock B Return (%) |
|---|---|---|
| 1 | 2.1 | 5.3 |
| 2 | 1.8 | -2.1 |
| 3 | 2.4 | 8.7 |
| 4 | 2.0 | -1.5 |
| 5 | 2.2 | 6.2 |
| 6 | 1.9 | -3.8 |
| 7 | 2.3 | 9.1 |
| 8 | 2.1 | -0.7 |
| 9 | 2.0 | 7.4 |
| 10 | 2.2 | -2.9 |
| 11 | 1.8 | 5.6 |
| 12 | 2.1 | -4.2 |
Calculation:
- Stock A mean return: 2.09%
- Stock A standard deviation: 0.19%
- Stock B mean return: 2.58%
- Stock B standard deviation: 5.42%
Interpretation: While Stock B has higher average returns, it also has much higher volatility (standard deviation). Stock A provides more consistent returns with lower risk.
Example 2: Manufacturing Quality Control
Scenario: A factory measures the diameter of 100 ball bearings (target: 20.00mm):
Sample Data (mm): 19.98, 20.01, 19.99, 20.02, 19.97, 20.00, 20.03, 19.98, 20.01, 19.99
Calculation:
- Mean diameter: 20.00mm
- Standard deviation: 0.02mm
- Process capability (Cp): 1.67
Interpretation: The low standard deviation indicates excellent precision. The process is capable (Cp > 1.33) and centered on the target specification.
Example 3: Educational Test Scores
Scenario: A teacher analyzes exam scores (out of 100) for 30 students:
| Score Range | Class A (n=30) | Class B (n=30) |
|---|---|---|
| 90-100 | 5 students | 3 students |
| 80-89 | 10 students | 8 students |
| 70-79 | 8 students | 10 students |
| 60-69 | 4 students | 6 students |
| Below 60 | 3 students | 3 students |
| Mean Score | 78.5 | 76.2 |
| Standard Deviation | 10.1 | 12.4 |
Interpretation: Class A has both higher average scores and lower standard deviation, indicating more consistent performance. Class B shows greater variability in student achievement.
Standard Deviation in Data & Statistics
Comparative analysis of statistical measures
Standard deviation is one of several measures used to understand data distribution. This table compares it with other common statistical metrics:
| Metric | Formula | Interpretation | When to Use | Sensitivity to Outliers |
|---|---|---|---|---|
| Standard Deviation | √[Σ(xi – μ)² / N] | Average distance from mean | When you need precise measure of variability | Moderate |
| Variance | Σ(xi – μ)² / N | Average squared distance from mean | For mathematical calculations | High |
| Range | Max – Min | Difference between highest and lowest values | Quick data spread assessment | Extreme |
| Interquartile Range | Q3 – Q1 | Middle 50% spread | When outliers are present | Low |
| Mean Absolute Deviation | Σ|xi – μ| / N | Average absolute distance from mean | For simpler interpretation | Moderate |
This comparison shows why standard deviation is often preferred:
- Unlike range, it uses all data points
- More interpretable than variance (same units as original data)
- Less sensitive to outliers than range
- Essential for calculating confidence intervals
- Foundation for z-scores and normal distribution analysis
Standard deviation also plays crucial roles in:
| Application | How Standard Deviation is Used | Example |
|---|---|---|
| Hypothesis Testing | Determines statistical significance | t-tests, ANOVA |
| Control Charts | Sets upper/lower control limits | Six Sigma processes |
| Risk Management | Quantifies volatility | Value at Risk (VaR) |
| Machine Learning | Feature scaling normalization | Z-score standardization |
| Survey Analysis | Measures response consistency | Likert scale reliability |
For more authoritative information on statistical measures, consult these resources:
Expert Tips for Working with Standard Deviation
Professional insights for accurate analysis
Data Collection Tips
-
Ensure sufficient sample size:
- Minimum 30 data points for reliable estimates
- Use power analysis to determine required n
-
Check for normality:
- Standard deviation assumes normal distribution
- Use Shapiro-Wilk test for small samples
- For non-normal data, consider IQR
-
Handle outliers properly:
- Investigate extreme values before removal
- Consider winsorizing instead of truncating
Calculation Best Practices
-
Choose correct formula:
- Use population formula for complete datasets
- Use sample formula for estimates
-
Maintain precision:
- Carry intermediate calculations to 6+ decimals
- Round final result to 2-3 decimals
-
Verify calculations:
- Cross-check with alternative methods
- Use statistical software for validation
Interpretation Guidelines
-
Rule of Thumb:
- ≈0: All values nearly identical
- Small: Values close to mean
- Large: Values spread out
-
Empirical Rule (68-95-99.7):
- 68% of data within ±1σ
- 95% within ±2σ
- 99.7% within ±3σ
-
Coefficient of Variation:
- CV = (σ/μ) × 100%
- Useful for comparing variability across datasets
Common Mistakes to Avoid
- Confusing population vs. sample standard deviation formulas
- Ignoring units of measurement in interpretation
- Assuming standard deviation alone tells the whole story
- Comparing standard deviations from different scales
- Neglecting to check for data entry errors
- Using standard deviation with ordinal data
- Interpreting standard deviation as a percentage
Standard Deviation FAQ
Expert answers to common questions
What’s the difference between standard deviation and variance?
Standard deviation and variance are closely related but serve different purposes:
- Variance is the average of squared differences from the mean (σ²)
- Standard deviation is the square root of variance (σ)
- Variance is in squared units, while standard deviation is in original units
- Standard deviation is more interpretable for most practical applications
Example: If measuring heights in centimeters, variance would be in cm² while standard deviation would be in cm.
When should I use sample vs. population standard deviation?
Choose based on your data context:
| Population Standard Deviation | Sample Standard Deviation |
|---|---|
| You have complete data for entire group | Your data is a subset of larger population |
| Formula uses N in denominator | Formula uses n-1 (Bessel’s correction) |
| Example: All students in a specific class | Example: 100 voters surveyed from entire electorate |
| Notation: σ (sigma) | Notation: s |
Using the wrong formula can lead to biased estimates, particularly with small samples.
Can standard deviation be negative?
No, standard deviation cannot be negative because:
- It’s derived from squared differences (always non-negative)
- The square root function returns the principal (non-negative) root
- A standard deviation of zero indicates all values are identical
If you encounter a negative standard deviation, it indicates:
- Calculation error (likely in intermediate steps)
- Software bug in the computation
- Misinterpretation of the result
How does standard deviation relate to the normal distribution?
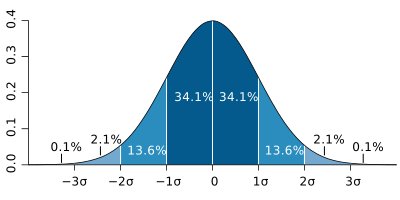
Standard deviation is fundamental to the normal (Gaussian) distribution:
- The mean (μ) and standard deviation (σ) completely define a normal distribution
- About 68% of data falls within ±1σ of the mean
- About 95% within ±2σ
- About 99.7% within ±3σ (the “three sigma rule”)
This relationship enables:
- Probability calculations using z-scores
- Confidence interval construction
- Hypothesis testing procedures
- Process capability analysis
What’s a good standard deviation value?
“Good” depends entirely on context:
| Context | Low Standard Deviation | High Standard Deviation |
|---|---|---|
| Manufacturing | Desirable (consistent quality) | Problematic (inconsistent products) |
| Investments | Low risk (stable returns) | High risk (volatile returns) |
| Test Scores | Uniform student performance | Diverse student abilities |
| Scientific Measurements | Precise instrumentation | Measurement errors |
To evaluate:
- Compare to historical values in your field
- Calculate coefficient of variation (σ/μ)
- Consider your specific requirements
- Benchmark against industry standards
How do I calculate standard deviation manually?
Follow these steps for population standard deviation:
-
Calculate the mean (μ):
Sum all values and divide by count (N)
-
Find deviations from mean:
For each value, subtract the mean (xi – μ)
-
Square each deviation:
(xi – μ)²
-
Sum squared deviations:
Σ(xi – μ)²
-
Divide by N:
Variance = Σ(xi – μ)² / N
-
Take square root:
Standard Deviation = √Variance
Example Calculation:
Data: 2, 4, 4, 4, 5, 5, 7, 9
- Mean = (2+4+4+4+5+5+7+9)/8 = 5
- Deviations: -3, -1, -1, -1, 0, 0, 2, 4
- Squared: 9, 1, 1, 1, 0, 0, 4, 16
- Sum: 32
- Variance: 32/8 = 4
- Standard Deviation: √4 = 2
What are some alternatives to standard deviation?
Consider these alternatives when standard deviation isn’t appropriate:
| Alternative | When to Use | Advantages | Disadvantages |
|---|---|---|---|
| Interquartile Range (IQR) | Non-normal distributions, outliers present | Robust to outliers, easy to understand | Ignores extreme values, less efficient |
| Mean Absolute Deviation (MAD) | When you need simpler interpretation | Same units as data, easier to compute | Less mathematically tractable |
| Median Absolute Deviation (MedAD) | Robust statistical applications | Highly resistant to outliers | Less intuitive for many users |
| Range | Quick data spread assessment | Simple to calculate and understand | Only uses two data points |
| Coefficient of Variation | Comparing variability across scales | Unitless, allows cross-comparison | Undefined when mean is zero |
Choose based on your data characteristics and analysis goals.